Smart Surfaces Coalition Smart Surfaces Resilience Opportunity Mapper

City lights at night

Identify resilience opportunities in Baltimore

Photo by Yianni Mathioudakis on Unsplash

The Smart Surfaces Coalition's (SSC) Resilience Opportunity Mapper (ROM) is a free, map-based tool that helps you explore how Baltimore's existing surfaces shape heat and stormwater risk, and identify where implementing Smart Surface strategies could do the most good.

Explore the data

Choose a starting point

Each starting point screens on a different piece of the risk picture – where heat and stormwater hazards are most intense (exposure), and where residents are least equipped to cope (sensitivity and adaptive capacity). You can customize filters once inside a given view.

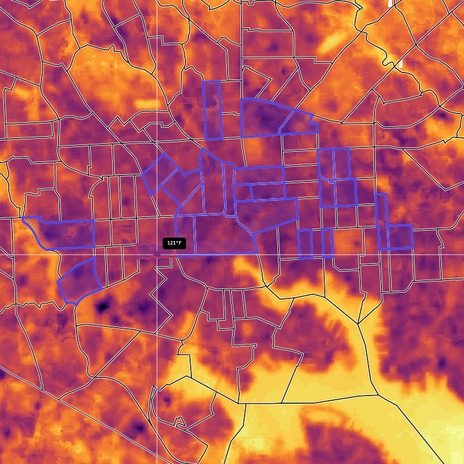
Land surface temperature across Baltimore with the 24 hottest low-cooling-access tracts outlined

Find the hottest tracts with limited cooling access

Opens on the 24 tracts with the highest land surface temperatures that also have households without air conditioning, identifying where heat exposure is most severe and residents have the least protection from it.

Maps
Tree canopy, baseline air temperature, land surface temperature, and combined modeled temperature change
Charts
No-AC histogram, impervious-vs-land surface temperature scatter, and a no-AC-vs-tree-cover scatter.
Filters
Land surface temperature in top quartile and households without air-conditioning access in top quartile.
Open this view
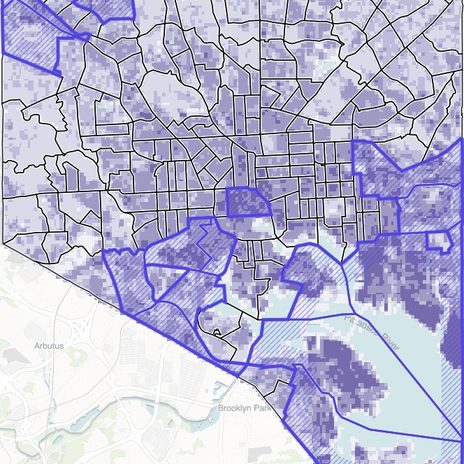
Baseline stormwater runoff across Baltimore with the 15 highest-runoff, heavily paved tracts outlined

Find heavily paved tracts with the highest stormwater runoff

Opens on the 15 census tracts carrying the highest baseline runoff that are also heavily paved, identifying where green stormwater infrastructure or depaving strategies could be sited to capture large volumes.

Maps
Baseline stormwater runoff and fractional vegetation
Charts
Baseline-runoff histogram and a land-area-vs-runoff scatter.
Filters
Baseline runoff greater than 100 cubic feet per second; impervious % in the top 75th percentile.
Open this view
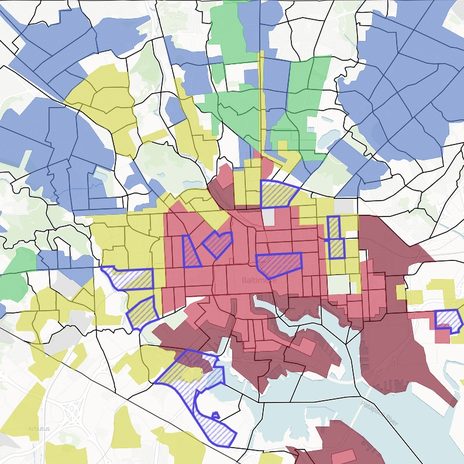
Historic redlining (HOLC) grades across Baltimore with the 11 most vulnerable tracts outlined

Find tracts facing overlapping vulnerabilities

Opens on the 11 tracts that rank among the most vulnerable on several fronts at once, identifying opportunities for investing in environmental justice for Baltimore residents.

Maps
Historic redlining (HOLC grades) and tree canopy cover
Charts
Low income, Black-population, and food insecurity histograms and an asthma-vs-energy-burden scatter.
Filters
Social vulnerability in the top quartile citywide; energy burden, asthma, and lack of air-conditioning access each in the top quartile.
Open this view

More starting points are in development, built around the policy questions cities ask most often. If your team needs one, tell us.

Have a snapshot file?

Reopen a session a colleague shared with you, exactly as they left it.

Purpose and scope

Understanding how to mitigate heat and stormwater risk requires a holistic view. Most relevant datasets live in separate workflows, which makes it hard to reconcile issues or surface key patterns. ROM was built as a single place to do that work.

Developed by the Smart Surfaces Coalition (SSC) and its partners, ROM helps civic leaders understand how existing surfaces shape heat and stormwater risk, and identify where to implement high-impact Smart Surface strategies across a city.

It brings together data on surface conditions, heat and stormwater risk, and social vulnerability alongside modeled estimates of how Smart Surface strategies would reduce temperatures and runoff. Users can filter and query across these layers to locate where risk and intervention potential overlap, then export results directly into planning documents, policy justifications, and grant applications.

What you can do with ROM

Explore risk
See where heat and stormwater runoff risks are concentrated across the city, and where they overlap.
See the impact
Compare baseline conditions against modeled outcomes to see how much cooling and stormwater reduction Smart Surface strategies could achieve.
Target need
Bring surface, risk, and social vulnerability data together to find high-need, high-impact areas.
Query and filter
Answer specific planning questions – high heat and low tree canopy, for example – through structured queries.
Export for action
Pull maps, data, and summaries into hazard mitigation plans, resilience plans, budget justifications, and grant proposals.

Current version

Release
ROM v1.0
Launched
August 28, 2026
City build
Baltimore, Maryland
Partner
City of Baltimore
Support
Waverley Street Foundation
View changelog
Aug 28, 2026
ROM launches for Baltimore.

Developed in close partnership with the City of Baltimore, with support from the Waverley Street Foundation, as the first city build of a tool designed to scale to additional cities and regions.

Contact us

Interested in bringing ROM to your city, exploring partnership opportunities, or learning more about Smart Surface strategies? Write to data@smartsurfacescoalition.org.

You can also join our Peer Learning Network or subscribe to the newsletter to stay informed about tool updates and expansion opportunities.